Detecting handle leaks
The example program is run once and we use the Memory view to observe and investigate the handle leak.

launch nativeExample.exe  wait until attaching is complete

 Handles menu Start Thread File menu Exit
wait for data transfer to complete
•Memory tab Refresh shows all leaked memory and any handles that have not been deallocated
Common handle leaks might come from forgetting to release a device context (DC), forgetting to reset brushes, pens, and other graphical items, file, DLL or thread handles.
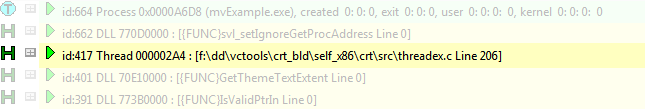
One of the leaks is a thread handle:
•expand the entry expand the OnHandlesStartthread entry on the callstack the source shows where the handle was allocated in the example application
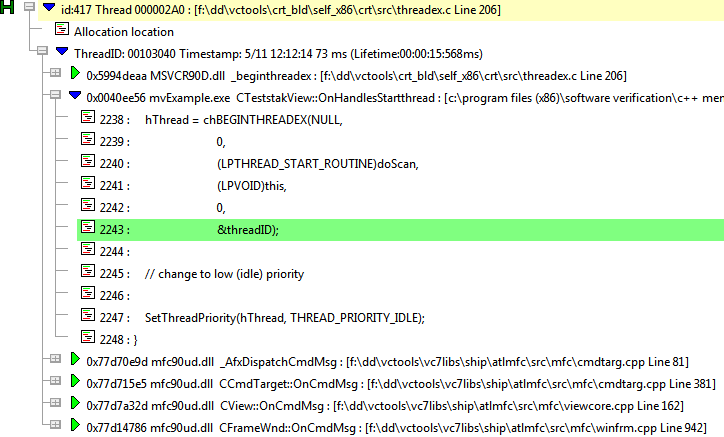
The top entry in the callstack shows the _beginthreadex() call in threadex.c (MSVCR90D.DLL) where CreateThread() would be called.
Hey, some leaks aren't leaks!
Handles are sometimes shown that aren't really leaked, but where deallocation hasn't been 'seen' by Memory Validator.
This is typically because the deallocations are done by kernel internals and don't pass via Memory Validator's hooking mechanism.
Other handles might be leaked by errors in 3rd party code.
As a result, handles such as bitmaps and icons sometimes show up in the display.
For your program, you'll need to decide which handle leaks are important by examining callstacks and using filters to remove unwanted handles from the display.