The Branch Coverage tab view displays branch coverage information for each function that contains branches.
 Read on, or click a part of the image below to jump straight to the help for that area.
Branches
The branch coverage focuses only on those areas of code which are conditionally executed.
This includes if / else statements and conditional loops such as for and while.
When viewing the source code, only the first line in each branch is marked. This is because any subsequent lines in the same code block must also be executed as part of the same branch.
As with many of the tab views, the display is split into two resizable panes.
•the left side lists a summary of the branch coverage data
•the right side shows source code for any method selected on the left
We'll cover the data view and its popup menu first, and then the source code view.
The data view

Each line in the view displays the following:
•the file, class, method or function, depending on the Type of the view
•the percentage of hookable branches that have been visited in the function
•the number of hooked branches in the function
This is not the same as the number of hookable branches since some lines or functions can be excluded from hooking.
•the number of different branches that have been visited in the function
•the total visit count for all the branches in the function
This may be equal to the number of different branches visited unless you're counting each visit separately.
•the DLL in which the method was found
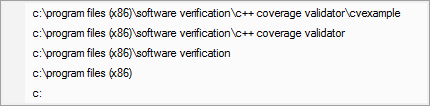
The Branch Coverage can show a hierarchical or list view of data according to the Type setting.
A hierarchical view is shown when the Type is set to one of the following:
•class / method
•file / function (the default)
•directory structure / file / function
Examples:
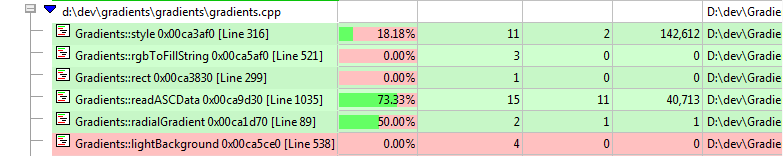
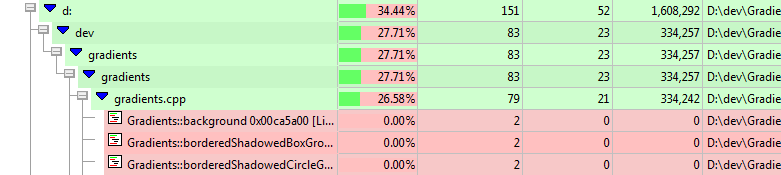
 For class and directory hierarchical views, the statistics against each directory or class is an aggregated sum of all the contained branches
A hierarchical view is shown when the Type is set to one of the following:
•method or function
•class or method (ordered by number of lines in file)
Example:
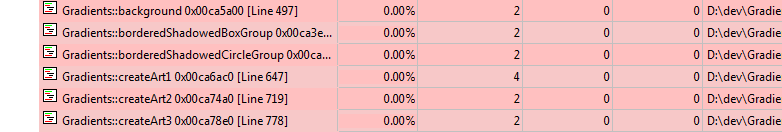
Only the first column in the view can be used for sorting the data.
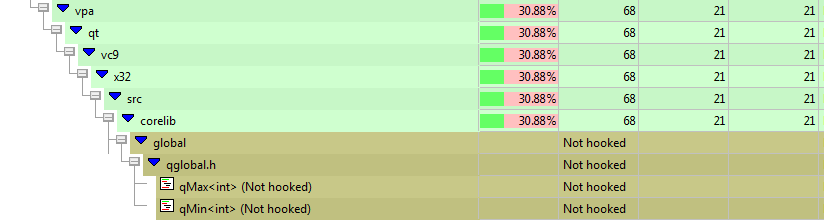
Unhooked lines
Depending on what file or DLL hook filters are set up, not all the hookable lines in a header file may attempt to be hooked.
Only those that are actually used (e.g. via macros or inlines) in the program may actually be hooked.
By default, lines that could not be hooked don't stop the coverage from reaching 100%, but you can change this.
In this example below, the instrumentation level was set low ('incomplete but faster') to force significant numbers of unhooked lines.
Line colours
Each line of data in any of the views is colour coded to indicate one of the following:
•the function has not had any branches visited at all

•some but not all branches in the function have been visited

•every hookable branch in the function has been visited, i.e. 100% file coverage

•no branches in the function could be hooked

Unhookable branches are likely when the instrumentation level is set low, for example 'incomplete but faster'.
Scrollbar visualisations
To the right of each pane, beside the vertical scrollbars, you'll see a coloured area which represents the coverage.
As with the scrollbar visualisation in the Coverage tab, the bar in the left hand pane shows an overall view of the coverage distribution across every function listed.
However, because branch coverage is broken down to the function level, selecting a function in the left hand pane will only highlight branches in the source code view for that function.
Branch coverage options
The branch coverage controls are shown below.

Window orientation
The horizontal or vertical orientation of the statistics and source code panes can be toggled with the orientation button.


Updating the display
•Refresh  updates the display - as does the
  button on the Tools menu and toolbar
View type
Changing the Type alters the view to one of the hierarchical or list views described earlier.
•By Class shows a hierarchical C++ class / method view
•By Function Name shows a list of all functions sorted by name
•By Directory shows a hierarchical view of directory / file / function
•By File shows a hierarchical file / function view
•By Number of Lines shows a list of classes or methods ordered by number of lines in file
Each view shows the same overall data, just in different arrangements
Sort order
•Descending reverses the direction of the data, sorted by the names in first column
Expanding and collapsing the data
•Expand All / Collapse All switches any hierarchical view between collapsed and expanded view
•Collapsed sets the preferred state of the view when the data is refreshed
This includes when you change some of the other display settings.
Display settings
•Display... displays the branch display settings dialog
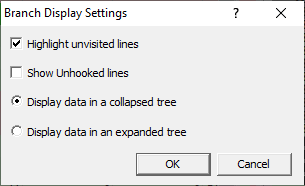
•Highlight unvisited lines highlights rows for branches that have not been visited (on by default)
If switched off, unvisited lines appear white - or whatever colour you've set as the unselected colour.
•Show unhooked functions display information about functions that could not be hooked (off by default)
This means unhookable lines, for example lines that were too short, rather than lines or functions that are deliberately set not to be hooked.
File list menu options
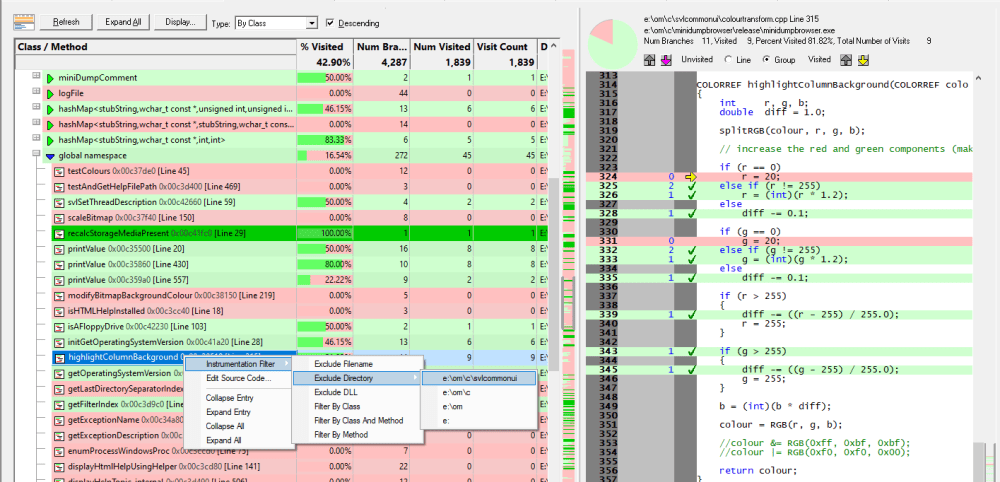
The following popup menu is available over the data area to add filters, edit code, or expand and collapse the view.
Menu options: Instrumentation Filter
The instrumentation filter lets you add filters at different levels of granularity:
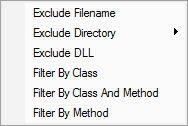
•Exclude Filename adds a new filter to the Source Files Filter settings, excluding it from the results of subsequent sessions
•Exclude Directory excludes all files in the same directory as the selected file
From the sub menu, choose the directory level at which you want to exclude files, right up to the drive specifier if you need to.
•Exclude DLL excludes all files belonging to the same executable or DLL as the selected file
This adds a filter to the Hooked DLLs settings.
The other options all add a filter to the Class and function filter settings
•Filter By Class excludes all functions in the selected class
Example filter: CTeststakDoc::
•Filter By Class And Method excludes only the selected class functions
Example filter: CTeststakDoc::OnNewDocument
•Filter By Method excludes only the selected method, whether in a class or the global namespace
Example filter: OnNewDocument
Filters become effective at the start of the next session. Adding a filter during a session will show the relevant rows in grey so that you can see which files would be filtered, but the coverage results will continue to be included for the rest of the current session.
Menu option: editing source code
•Edit Source Code... opens the default or preferred editor to edit the source code
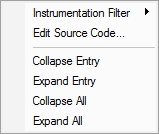
Menu options: collapse / expand trace
•Expand or Collapse Entry shows and hides the selected section in the view, the same as using the  or
or  buttons
•Collapse All completely collapses all sections
•Expand All expands all the sections
The branch source code view
Clicking on a function in the left hand panel, shows that file and function in the source code view on the right.
The source code uses syntax highlighting by default, with the background colour of the line indicating if the branch line has been visited, is unvisited or could not be hooked.
Icons are displayed next to hooked and unhooked branch lines indicating visit and hook status and visit counts are shown in-line with the code.
Hovering over a line for a short period of time shows a tooltip with the number of visits to the line.
Contiguous groups of lines can be collapsed and hidden from view.
Source code branch information
On the right hand panel, above the source code, you'll find some information about branches in the selected function in the source file
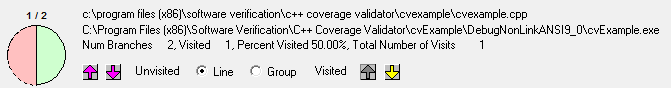
The details shown include the following:
•'quick view' details for visited and unvisited branches in the function, pink for unvisited, light green for partial visited, and dark green for 100% visited


•the source code filename and the executable or DLL to which it belongs

•the same branch statistics as seen in the left hand panel

Browsing visited and unvisited lines
• show the previous and next unvisited branch in the function
 and
and  + also navigate forwards and backwards when the source code has focus.
• show previous and next visited branch in the function
The arrows are grey when disabled.
 and + also navigate forwards and backwards through the visited lines.
•Line step by individual lines of code
•Group step by groups of contiguous visited or unvisited lines
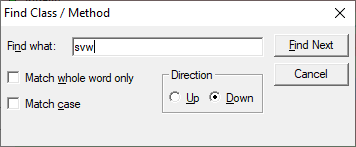
Keyboard access: Find and Goto
When the data view or the source code view has focus, some keyboard access is available to search for text, or to navigate to numbered lines.
Find text in data view
In the data view,  +
+  displays a dialog that will allow you to search by full or partial match for text in the first column - the contents of which depends on the Type setting.
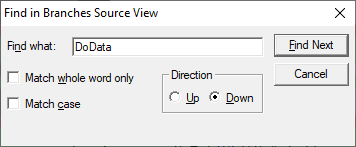
Find text in source view
In the source code view + lets you search by full or partial match anywhere in the file.
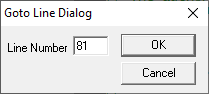
Goto line
In the source code view, +  displays a goto-line dialog.
.