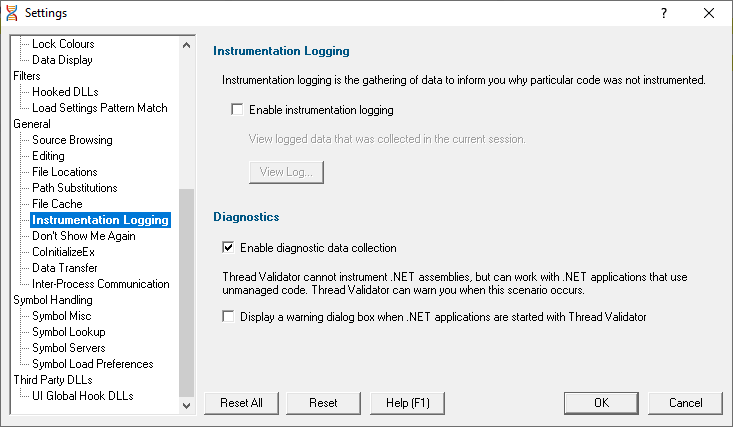
The Instrumentation Logging tab enables you to understand the reason why part of your code isn't getting the threading information you expect.
Instrumentation logging
The logging of DLLs, source files, classes, methods and functions that are not instrumented can help you understand the reason why part of your code isn't getting the coverage information you expect.
Once enabled, and a session has started, you can view a list of items that have not been instrumented via the Tools menu.
•Enable instrumentation logging  check to enable logging once the next session starts
Diagnostics
A lot of diagnostic information is collected and displayed on the diagnostic tab when attaching to a target program.
Some of this information is always sent to Thread Validator, but you may not want to see it all.
•Enable diagnostic data collection displays all diagnostic information in the diagnostic tab (on by default)
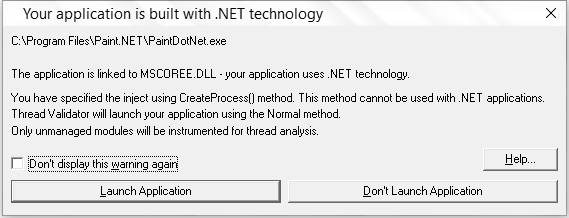
.NET warning
Thread Validator cannot instrument .NET assemblies and cannot monitor locks and thread synchronization primitives called from them (also known as "managed code").
However, locks and thread synchronization primitives can be monitored in any non-.NET DLLs even if part of a .NET application.
You can optionally be warned when trying to launch a .NET application:
•Display a warning dialog box when .NET applications are started shows a warning dialog (example below) when using .NET applications (on by default)
•Help... will open the manual for User Permissions Warnings
Reset All - Resets all global settings, not just those on the current page.
Reset - Resets the settings on the current page.