The Callstack tab allows you to specify how the callstack is collected, and how information about the callstack is displayed.
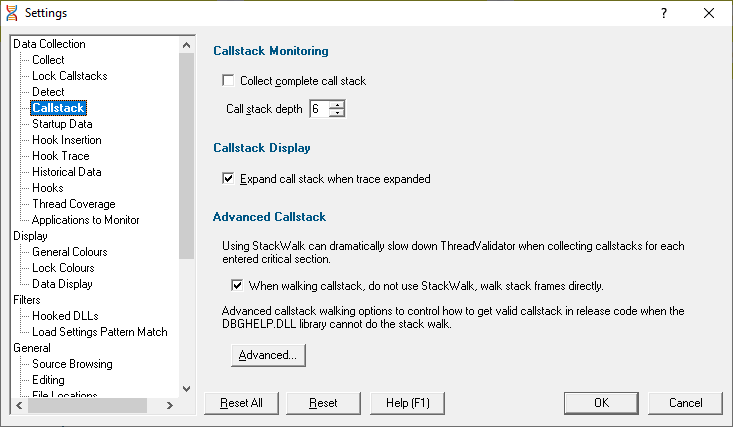
Callstack Monitoring
When Thread Validator stub collects callstacks for each hooked function, the stack traces can be very long.
Collecting longer stack traces means:
•collecting stack traces takes longer
•converting all the addresses in the stack trace to symbol names takes more time
•the target program runs slower
•more memory is consumed in the Thread Validator user interface
For this reason, you're able to specify whether you want complete or partial stack traces.
•Collect complete call stack  check for complete traces, uncheck to collect partial traces
Specify the exact depth you wish to capture with the Call stack depth option
Callstack Display
Data items recorded by Thread Validator can be displayed with parameter names as well as being automatically expanded.
•Show parameter names check to show parameter names shown with the function name
•Expand call stack when trace expanded check to automatically expand the entire callstack when examining a data item
Advanced Callstack
As the title suggests, these callstack options are advanced and not usually necessary to change unless you are experiencing incomplete stack traces.
Thread Validator collects callstacks by walking along the stack frames. When no more stack frames can be walked, Thread Validator uses DbgHelp StackWalk() to attempt to walk any remaining stack frames.
StackWalk() is much slower than Thread Validator's direct stack walking. Calling StackWalk() to attempt to walk any remaining stack frames may not result in any extra stack frames being walked, but will result in slower execution of your application.
On the other hand, not using StackWalk() may result in shorter callstacks being collected.
•When walking callstack, do not use StackWalk... prevent Thread Validator using StackWalk()
You may have problems collecting some callstacks in release mode programs, and in some special cases in debug programs depending on your program.
In addition to the optimisation described above, Thread Validator provides three different methods of collecting callstacks for functions. These methods are in the Advanced section described below and are provided to allow you to tailor callstack collection to the task at hand.
As the title below suggests, the remaining options are for advanced use! An example might be if you find your program has a problem that can be identified, but for which the callstack cannot be collected properly.
Advanced callstack settings
•Callstack walk helper size Specify the size of the cache used to optimize callstack walking
Thread Validator uses a cache to help it optimize the callstack walking process. The cache is used to avoid calling operating system functions to walk the callstack when the result has been previously calculated.
For applications generating many unique callstacks, this size may need to be increased.
All sizes are prime numbers, and the default size is 100003 which is large enough for most applications. If in doubt leave it at the default value of 100003
Callstack walking
Thread Validator provides three different methods of collecting callstacks for functions which you can choose to tailor callstack collection to the task at hand.
1) The standard Microsoft® DbgHelp StackWalk() function
This function is optimised for walking standard Intel i386 stack frames where the EBP register is pushed on to the stack at function entry and popped from the stack when the function exits. This is the typical stack frame for a program built in debug mode.
The DbgHelp StackWalk() function is also capable of reading frame pointer omission data (FPO_DATA) included in a PE file. FPO_DATA is included in optimised binaries that do not use the EBP register to identify the stack frame - this is typical of a program built in release mode.
2) Alternative (custom) StackWalk() function
This proprietary method, although slower than Microsoft's stack walker, does not use stack frames to walk the stack, and so enables the stack walker to walk callstacks that DbgHelp StackWalk() cannot.
3) Hybrid of the two
The third stack walk type is a hybrid of the other two.
The first method is used to collect all callstacks. Any callstacks that are too short (defined by a callstack length threshold) then have the callstack collected by the second method.
This provides the speed and power of the standard Microsoft stack walker, with the flexibility to collect callstacks that would otherwise be uncollectible when DbgHelp StackWalk() fails to collect the callstack.
The Advanced Stack Walk dialog shown below is accessed via the Advanced... button and is used to choose one of the three callstack collection options above:
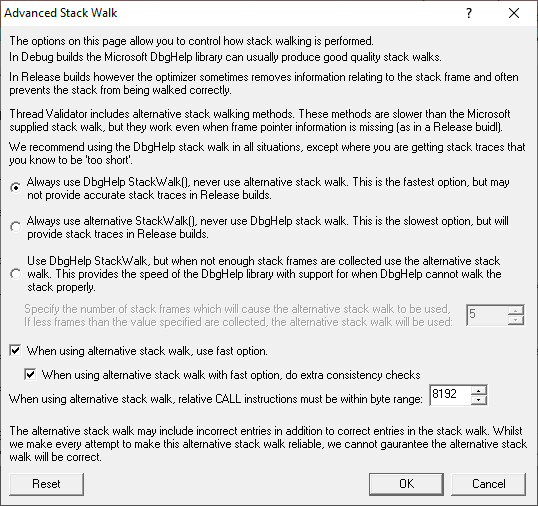
•DbgHelp StackWalk use the DbgHelp.dll StackWalk() function to walk all callstacks
You may have problems collecting some callstacks in release mode programs, and in some special cases in debug programs depending on your program.
•Alternative StackWalk use the alternative stack walking function to walk all callstacks
All callstacks will be collected in both debug and release mode programs, but you may find that some callstacks contain incorrect entries.
•Hybrid StackWalk use the hybrid method outline above
When the alternative stack walk is used you may find that some callstacks contain incorrect entries.
To specify when to use the alternative stack walking function, set a callstack depth.
Any standard callstacks that are shorter than the depth specified, will be collected using the alternative stack walking function.
 See also - recommended usage below
Alternative stack walk method - fast or slow?
•When using alternative stack walk, use fast option uses a faster address verification scheme (recommended) or a slower one
Do extra consistency checks When using the fast option, consistency checks can optionally be performed (recommended) to reduce the amount of incorrect addresses included in the callstack.
Alternative stack walk method - range of relative addresses
When the alternative stack walk is used, relative address CALL instructions have their target address computed to test if the target address is within a threshold of the previous callstack address.
This provides a form of source address to target address integrity to prevent invalid addresses be placed in the callstack.
•Relative CALL instruction byte range set the threshold which the target address must be within, to fine tune the stack walk
A larger threshold reduces the accuracy of the stack walk by allowing too many invalid addresses into the stack.
A smaller threshold reduces the accuracy of the stack walk by rejecting valid addresses from being placed in the callstack.
The default is a reasonably large 8192 bytes.
Alternative stack walk method - caveats
When the alternative stack walk is used you may notice some unusual data on the display:
•<UNKNOWN> symbols in the middle of call stacks
This happens rarely, because the address is not valid but for some reason was not rejected by the alternative stack walk.
•Symbols in the middle of callstacks that you know cannot be correct
This may happen because the address is valid, but not for this position in the callstack, and the address passed the alternative stack walk address verification tests - this address was most probably the target of an indirect CALL instruction, and as such, could not be verified.
•Callstacks for data that make no sense
This again is rare, but occurs due to Thread Validator monitoring its own behaviour (which can happen in a few limited circumstances). These callstacks are filtered in both stack walk methods, correctly in the standard one, but not perfectly in the alternative method!
Recommend usage
We recommend that in all situations the stack walking method used is either DbgHelp StackWalk or Hybrid StackWalk.
Only if you find your program has a problem that can be identified, but for which the callstack cannot be collected, do we recommend using Hybrid StackWalk or Alternative StackWalk as appropriate.
Reset
The Advanced Stack Walk dialog has a button labeled Reset at the bottom left of the dialog. This resets only the settings on this dialog back to their default values.
Reset All - Resets all global settings, not just those on the current page.
Reset - Resets the settings on the current page.