The Performance page allows you control how performance data is collected.
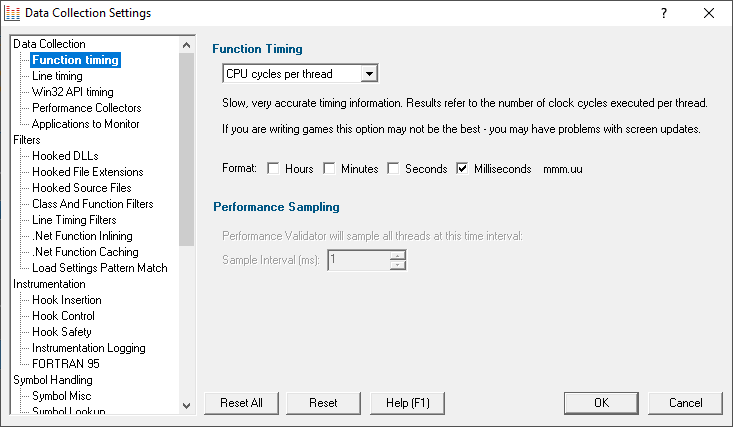
Performance Timing
There are a number of methods available for collecting performance data, with some of them being system dependent.
 When Performance Validator was installed, the most appropriate timing method was selected automatically.
Most of the options count every function visit, but the timing method is different:
•CPU cycles per thread  counts function visits and times them using the processor's instruction cycle counter on per-thread basis
Only CPU cycles used by the owning thread will be counted.
This method is slower but more accurate.
Recommended choice for: Windows Vista and onwards, although we have found that some games cannot be profiled with this setting as it interferes with the screen update.
•Performance Counters counts function visits and times the functions using a very accurate counter that is provided by modern computer chipsets
Your application will run slower than with the other options as the function calls to provide the accurate counter value are quite slow.
Recommended choice for: Windows XP and earlier with two or more processor cores.
•Time Stamp Counter counts function visits and times them using the processor's instruction cycle counter
If your processor does not support this option, you will not be able to select it.
Most modern processors (Pentium II, III, IV, Athlon etc) support this option.
Recommended choice for: Windows XP and earlier with just one processor core, running non-hyperthreaded applications.
•1 ms Accuracy counts function visits and times them using a fast function call that is only accurate to approximately 1ms
•Call Count counts function visits only - no timing information
•Sampling stops all application threads at specified intervals and records the callstack for each thread
Performance data is calculated based on each callstack.
The Statistics and Relations tabs will show Sample Count rather than Call Count data.
The Sample Count and Sample Count % statistics show how often a given function/file/line combination is identified in the sampling statistics.
The Call Tree tab and Analysis tab are the most useful way of analysing statistics gathered in Sampling mode.
Recommended choice for: quickly determining which areas of the application are running slowly before switching to a more accurate method, e.g. Performance Counters or Time Stamp Counter.
Time Format
The format of timing information in Performance Validator is controlled by the Format checkboxes.
Typically, you'd choose all the options up to one level, rather than mixing just hours and milliseconds for example!
Some examples are below, where HH means hours, MM minutes, SS seconds and mmm.uu means milliseconds.
•Hours + Minutes + Seconds + Milliseconds HH:MM:SS:mmm.uu e.g. 1:35:28:133.42
•Minutes + Seconds + Milliseconds MM:SS:mmm.uu e.g. 95:28:133.42
•Seconds + Milliseconds SS:mmm.uu e.g. 5,728:133.42
•Milliseconds mmm.uu e.g. 5,728,133.42
Performance Sampling
When the Sampling method is chosen above, you can specify if you want to sample all threads in the application, or just one thread of interest.
You cannot sample any threads that are created and required by Performance Validator.
•Sample All Threads all threads in the application will be sampled
•Sample One Thread only one thread will be sampled, as set below
•Thread to Sample (id) specify the id of the thread you want to sample
Setting an id of -1 means all threads will be sampled.
Since thread IDs are allocated after launch, you'll need to start the application, then choose the thread to sample.
•Sample Interval (ms) sets a sampling interval in milliseconds
50ms is a good starting point. 10ms or less will provide good sampling rates.
Depending on your application, you may be able to set intervals as low as 1ms.
If your application runs incredibly slowly, with sampling dominating your application's processing then try increasing the interval.
 In Sampling mode, Symbol Servers are not used.
Line Timing
In a similar way to Performance Timing above, the Line Timing options control how the line times are determined.
However, here there are just two relevant options:
•CPU cycles per thread Counts line visits and times them using the processor's instruction cycle counter on per-thread basis
Only CPU cycles used by the owning thread will be counted.
This method is slower but more accurate.
Recommended choice for: Windows Vista and onwards, although we have found that some games cannot be profiled with this setting as it interferes with the screen update.
•Time Stamp Counter Counts line visits and times them using the processor's instruction cycle counter
If your processor does not support this option, you will not be able to select it.
Most modern processors (Pentium II, III, IV, Athlon etc) support this option.
Recommended choice for: Windows XP and earlier with one processor core, running non-hyperthreaded applications.
Line Timing Warning
•Enable line timing warning controls an optional warning displayed when you enable line timing on the launch wizard/dialog
If enabled, a warning dialog is displayed to remind you of the possible performance slowdown when using line timing
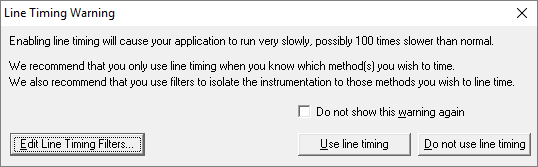
•Edit Line Timing Filters shows the Line Timing Filters settings dialog
Set specific classes, methods and functions to be included in, or excluded from, the hooking process.
This dialog is identical to the Line Timing Filters page of the global settings dialog.
Reset - Resets all global settings, not just those on the current page.