The Exception page displays the contents of the ExceptionStream minidump stream.
A few extra fields are displayed to provide additional information: Exception Symbol, Exception Filename, Exception DLL.
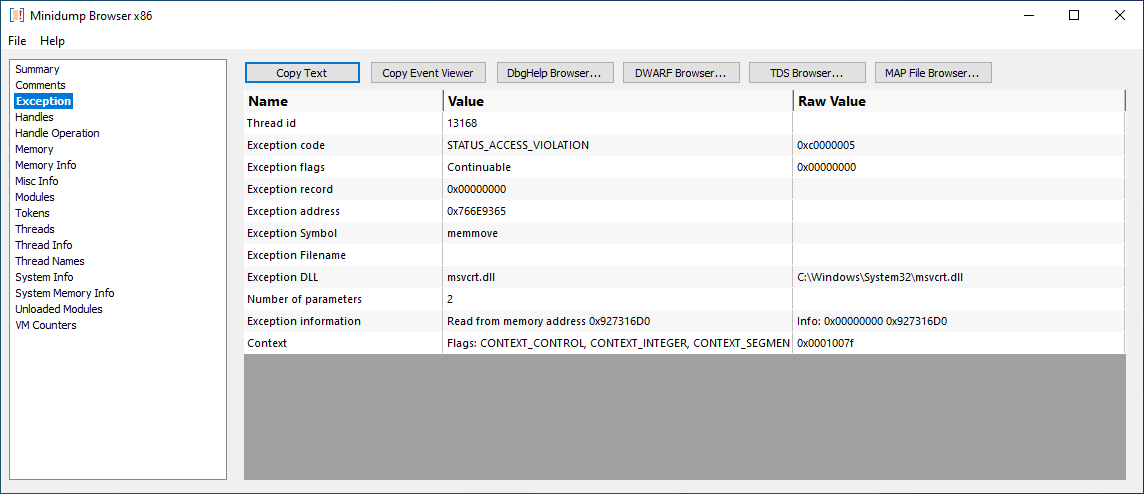
The top view shows exception specific information.
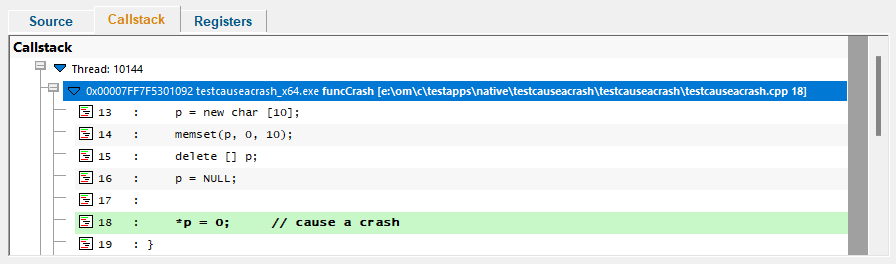
The lower view shows the source code for the crash location (if filename and line number information is available), the exception callstack, and all the registers from the exception CONTEXT.
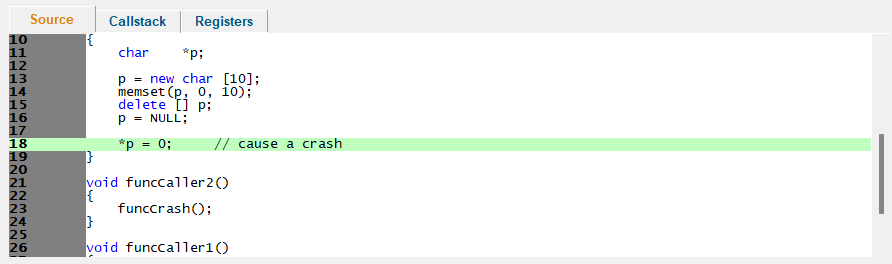
Expanding any callstack node will display source code for that location (if filename and line number information is available).
Copy Text
Copy Text copies the text from the grid to the clipboard.
Each column is separated with a comma. Each line is separated by "\r\n".
Copy Event Viewer
Copy Event Viewer copies the exception data to the clipboard in the same format as the Windows Event Viewer. You can paste this data into some of our other tools (Minidump Browser, MapFile Browser, TDS Browser).
An example of the data is shown below for an Access Violation at 0x0c18459c in devenv.exe.
<Event>
<System>
<Provider Name="Windows Error Reporting">
</System>
<EventData>
<Data></Data>
<Data></Data>
<Data>APPCRASH</Data>
<Data></Data>
<Data></Data>
<Data>C:\Program Files (x86)\Microsoft Visual Studio 10.0\Common7\IDE\devenv.exe</Data>
<Data></Data>
<Data></Data>
<Data></Data>
<Data></Data>
<Data></Data>
<Data>0xc0000005</Data>
<Data>0x0c18459c</Data>
<Data></Data>
<Data></Data>
<Data>STATUS_ACCESS_VIOLATION</Data>
<Data>OK</Data>
<Data></Data>
</EventData>
</Event>
Tools
If you have installed Minidump Browser, DWARF Browser, TDS Browser, MAP File Browser, the appropriate button to launch this tool will be enabled.
Launching the tool will attempt to load the appropriate PDB, DWARF, TDS, MAP data and then locate the symbol that matches the exception crash address.