Detecting double deallocations
The example program is run once and we use the Memory view to observe and investigate any double deallocations.
For each double deallocation, Memory Validator displays the allocation and deallocation locations.

•Memory tab  Display... check Memory Errors if not already checked.
 Settings menu Edit Settings... Data Collection Collect page check Memory Buffer detect enables the use of Uninitialized Data hooks
The target program will run slower than usual with this option as all functions related to strings and memory copying are monitored.
launch nativeExample.exe wait until attaching is complete

Memory Errors menu Buffer overrun submenu Overrun allocated memory allocates an array and the end of the array is deliberately overrun
In the Memory tab, the overrun corruption is detected and displayed

Memory Errors menu Buffer overrun submenu Underrun allocated memory allocates an array and the end of the array is deliberately underrun
In the Memory tab, the underrun corruption is detected and displayed

File menu Exit
wait for data transfer to complete
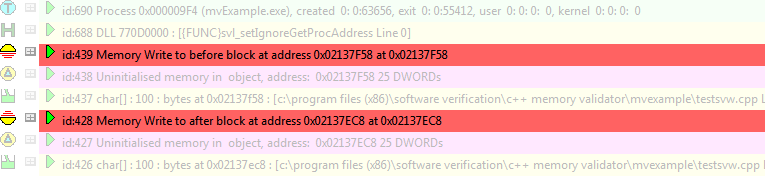
•Memory tab Refresh shows the usual leaks and also the two corrupted blocks using the colour defined.
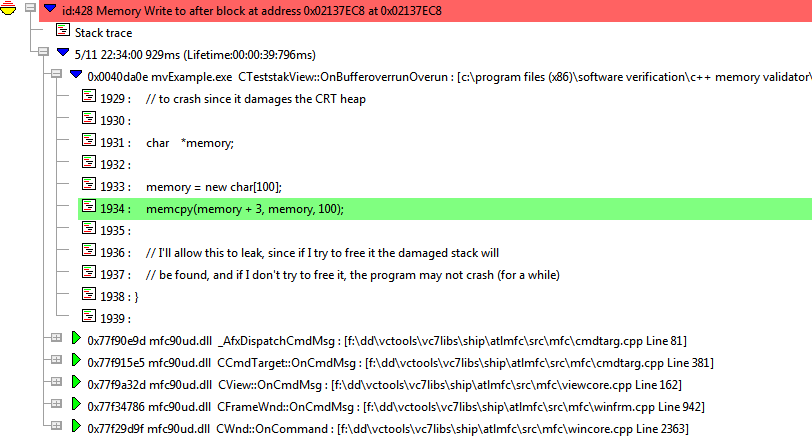
•expand the most recent corruption shows the callstack at the point of corruption
•expand the topmost entry in the callstack shows the source at the corruption point in CTeststakView::OnBufferoverrunOverun()
Searching for Memory Allocations
In the simple code of the example above we can see where the allocation is - on the line above the corruption point.
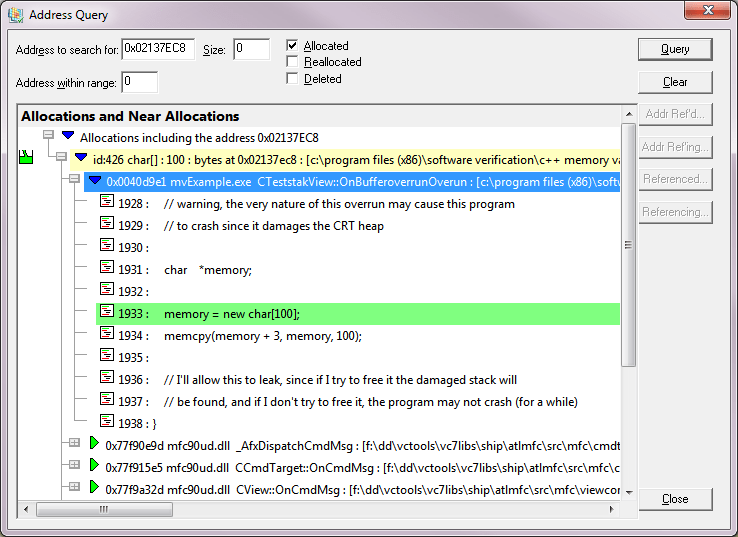
If we didn't know where the memory was being allocated, we can use the query address dialog.
•Make a note of the object address - e.g. in our example above 0x02137EC8
Query menu Query Address... enter the address in Address to search for Query shows all allocations including that address.
This should show a result that can be expanded to show the allocation location as the line above the corruption point we saw above.