The Exception Tracer user interface is shown below.
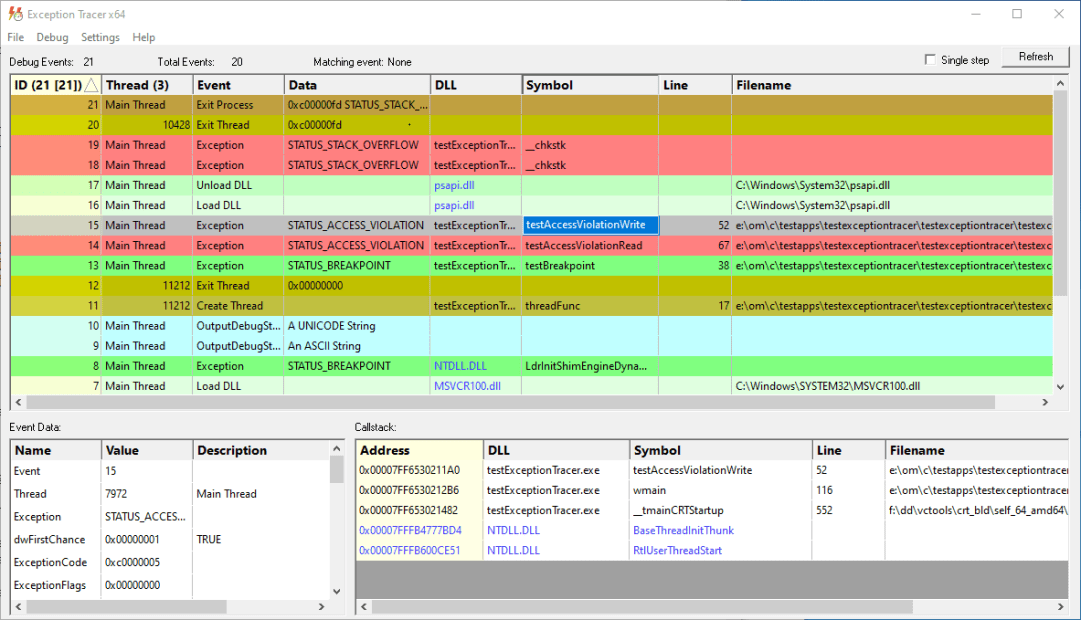
The display is split into three areas. The top grid displays debug events, one per line. The bottom two grids display event specific data for the event that is selected in the top grid.
The image above shows six exceptions (the first of which is the breakpoint exception that is always sent when a debugger attaches to a process). One of these exceptions, a write memory access violation, has been selected. The event data and callstack grids show data relating to this write memory access violation.
Single stepping can be enabled or disabled by selecting the Single Step check box. See the single step settings to configure what is collected.
If you have disabled updating of the user interface in the display settings you can manually update the display using the Refresh button.
Debug Events
Debug events are displayed in the top grid. Each line in the grid represents one event. Data displayed is the event id, thread name, event type, event data, DLL name, symbol name, line number and filename.
Thread names are sourced from thread naming exceptions and the GetThreadDescription() API (Windows 10 only). Thread names can also be entered via the user interface.
By default the most recent event is displayed first. You can change this from the settings dialog.
Additional sorting can be done by clicking on column headers. Click the column header to sort using that column. Click the same column header to reverse the sort direction.
Not every event will have valid data for each field.
The types of event are:
•Exception. Details about an exception. The event data grid shows the exception details. The callstack grid shows the callstack for the exception.
•Create Thread. A thread has been created. The thread start function is shown, as are the filename and line number if available.
•Create Process. A process has been created. The main thread start function is shown, as are the filename and line number if available.
•Exit Thread. A thread has ended. The thread exit code is displayed.
•Exit Process. A process has ended. The process exit code is displayed.
•Load DLL. A DLL has been loaded.
•Unload DLL. A DLL has been unloaded.
•OutputDebugString. A debugging string has been output using OutputDebugStringA() or OutputDebugStringW().
•RIP. An error reporting event has happened.
Event Data
When an event is selected in the top grid, the event data are displayed in the Event Data grid. The data displayed in the grid vary depending on what type of event has been selected.
Where possible addresses are converted into symbol names, filenames and line numbers, and error codes and other specific numeric values are converted into strings.
Callstack
When an event is selected in the top grid, if the event has an associated callstack, the callstack is displayed in the Callstack grid. Where possible addresses are converted into symbol names, filenames and line numbers.
Events Context Menu
The Debug Events grid has a context menu which you can access by right clicking on any event.
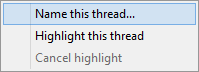
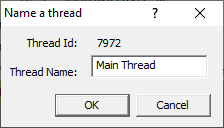
•Name this thread...  displays the Name a thread dialog
•Highlight this thread colours all debug events for this thread in the same colour
•Cancel Highlight cancels the highlighting
Callstack Context Menu
The Callstack grid has a context menu which you can access by right clicking on any callstack entry.
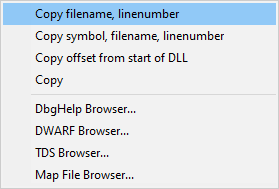
•Copy filename, linenumber Copies the filename and line number to the clipboard.
•Copy symbol, filename, linenumber Copies the symbol, filename and line number to the clipboard.
•Copy offset from start of DLL Calculates the stack location as an offset from the start of the DLL and copies it (in hex) to the clipboard.
•Copy Copies the entire line to the clipboard.
•Exception Tracer Exception Tracer is launched to open the PDB symbols associated with the crash DLL. The symbol at the stack location is then highlighted.
•DWARF Browser DWARF Browser is launched to open the DWARF symbols in the crash DLL. The symbol at the stack location is then highlighted.
•TDS Browser TDS Browser is launched to open the TDS symbols associated with the crash DLL. The symbol at the stack location is then highlighted.
•Map File Browser Map File Browser is launched to open the MAP file associated with the crash DLL. The symbol at the stack location is then highlighted.
If a tool is chosen that is not installed a prompt will be displayed to download the tool.
Colour Coding
For all three grids, where an event relates to Microsoft DLLs the text for these are colour coded blue to indicate they are different from events for your DLLs.