The No Coverage Data Collected warning dialog
The no coverage data collected warning dialog is displayed to warn you no coverage data has been collected.
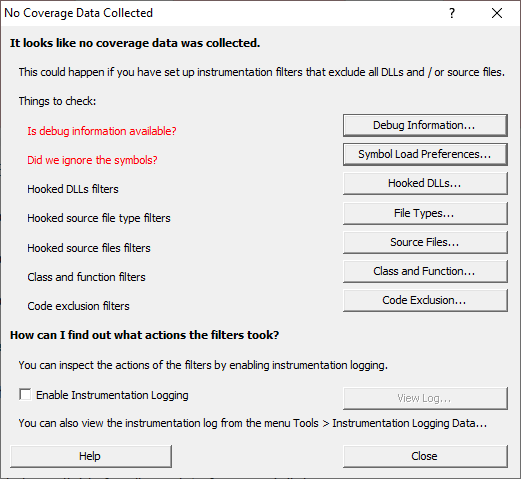
•Debug Information...  shows the DLL Debug Information dialog so that you can inspect which DLLs have debug information and understand why debug information may have failed to load.
•Did we ignore... shows the Symbol Load Preference dialog so that you can inspect which symbol types you are interested in and which you are ignoring. Sometimes you'll fail to load symbol information because you have your symbol load preferences incorrectly configured. In in doubt set them to "All Compilers".
•Hooked DLLs... shows the Hooked DLLs dialog so that you can choose which DLLs are processed for code coverage.
•File Types... shows the Source File Types dialog so that you can choose which source file types (file extensions) are processed for code coverage.
•Source Files... shows the Source Files dialog so that you can choose which source files are processed for code coverage.
•Class and Function... shows the Class and Functions dialog so that you can choose which functions, classes and class methods are processed for code coverage.
•Code Exclusion... shows the Code Exclusion dialog so that you can edit the code exclusion parameters that affect code coverage processing.
Why is this dialog displayed?
You will see a No Coverage Data Collected warning dialog in whenever no code coverage data is collected.
There are two main reasons for not getting any code coverage.
•No debug information.
•Instrumentation filters excluding too much data.
No Debug Information
There are many reasons that debug information may fail to load. This is discussed in detail in the DLL Debug Information topic.
Instrumentation Filters
Instrumentation filters are useful for focusing code coverage on the parts of your program that you are interested in.
However it's also possible to create combinations of filters than when used together exclude all code coverage locations from the result set. This results in no code coverage data.
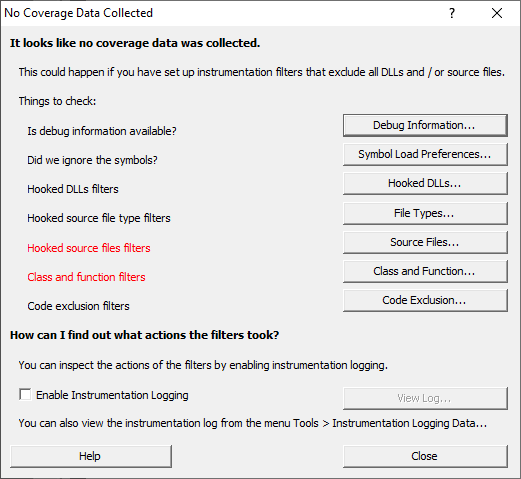
The five instrumentation filter groups are Hooked DLLs, Source File Types, Source Files, Class and Function filters and Code Exclusion pragmas.
You will need to examine the various filters to identify which filters need editing to prevent all code locations from being excluded from a code coverage report.
Items coloured in red are items that Coverage Validator thinks may be causing the problem. In the above image Is debug information available? indicates that the Debug Information should be inspected to ensure that the debug information has been found, and if not, why wasn't it found?
The Instrumentation Log
Sometimes it's hard to understand the behaviour of the filters by just looking at the filters.
It would be useful if you could see a log of the behaviour of the filters.
To do that select the Enable Instrumentation Logging check box and re-run your code coverage test.
When there is an instrumentation log to view you can view it using View Log... on this dialog or  Tools menu Instrumentation Logging Data...
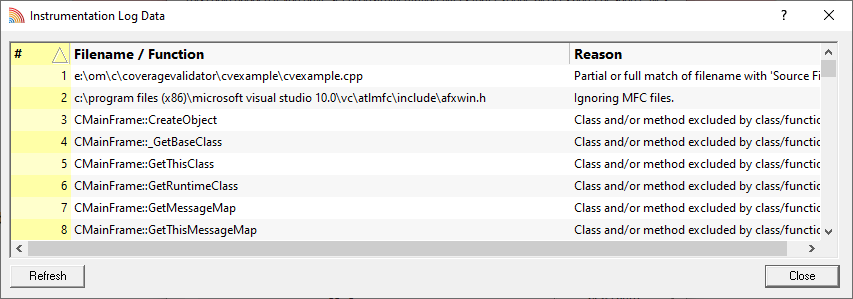
In the above image we can see:
•a filename match
•some MFC files are ignored
•some class and function filter matches
•some C runtime files are ignored
•in the area of the log we can't see are also entries describing DLLs that have been ignored (Microsoft and C runtime DLLs)
The filename match and the class and filter matches are of interest to us. We'll need to change these to ensure we get some code coverage results.