Memory Validator Tutorials

The Tutorials
How to detect memory leaks using Memory Validator
How to detect handle leaks using Memory Validator
How to detect memory leaks whilst your application is running
How to track memory allocations of a specific size using Memory Validator
How to monitor 3rd party memory allocation APIs using Memory Validator
How to view GDI objects using Memory Validator
How to detect COM Object Reference Count Errors using Memory Validator
Detecting memory leaks in a .Net Core application
Detecting memory leaks in a .Net Core application child process
Detecting memory leaks in a service
Detecting memory leaks in a service child process
Detecting memory leaks in an IIS ISAPI DLL
Detecting memory leaks in ASP.Net with IIS
Detecting memory leaks in ASP.Net with Web Development Server
Command Line Detecting Memory Leaks in a Child Process
Viewing GDI Objects
In this tutorial we’re going to show you how to use Memory Validator to view GDI objects in a running application.
Whilst debugging graphical applications, it can be useful to track GDI and USER objects to see if any resources are leaked. In the process of performing this task, whilst it is useful to have the handle value and stack trace for the allocation, it is also very useful to be able to view what the graphical object looks like.
Options
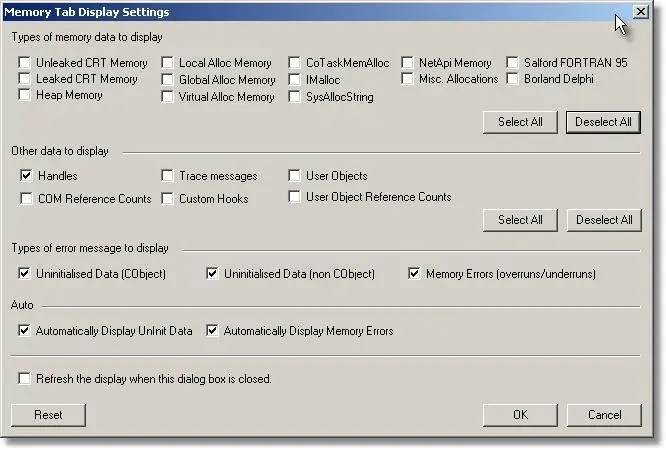
No specific options are required for this feature – you simply need to collect and display the appropriate handle types.
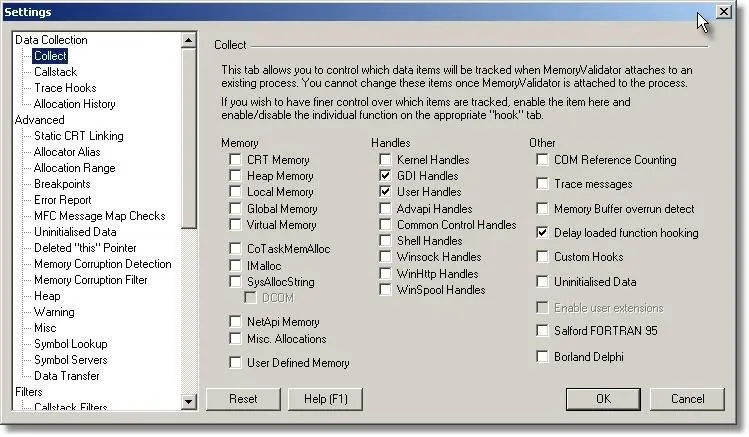
On the Memory tab display settings dialog, select the Handles check box.
On the Collect tab of the settings dialog, select the GDI Handles and User Handles check box.
Example
- Start the nativeExample.exe application.
- On the Handles menu, choose the Create Font option.
- On the Handles menu, choose the Create Pen option.
- On the Handles menu, choose the Create Brush option.
- On the Handles menu, choose the Create Bitmap option.
- Press Refresh on the Memory tab. All current memory and handles will be displayed.
- Find the entry for the font you created (you may need to scroll to the bottom of the display), and click on the entry with the right mouse button. A context menu will be displayed. As shown below:
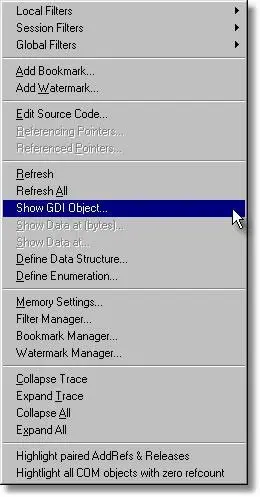
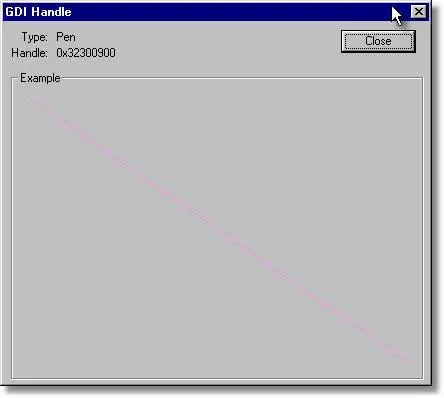
- Select Show GDI Object…. The Font selected will be shown in a dialog, as shown below:
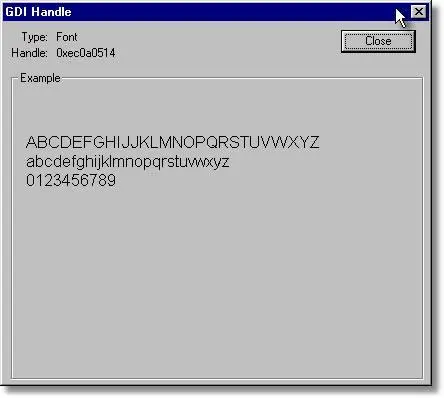
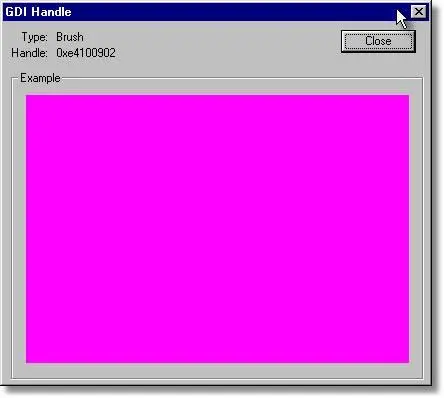
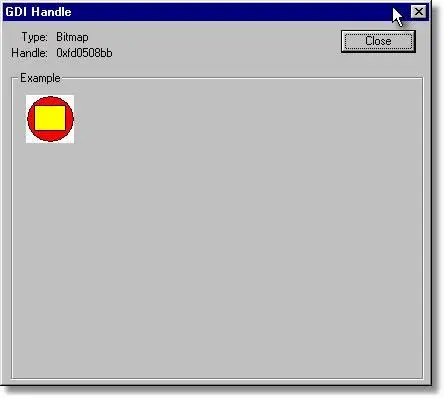
- Repeat this process of right clicking on the GDI object of interest and choosing Show GDI Object…. The appropriate dialog will be displayed. Samples for Pen, Brush and Bitmap are shown below.