Memory Validator Tutorials

The Tutorials
How to detect memory leaks using Memory Validator
How to detect handle leaks using Memory Validator
How to detect memory leaks whilst your application is running
How to track memory allocations of a specific size using Memory Validator
How to monitor 3rd party memory allocation APIs using Memory Validator
How to view GDI objects using Memory Validator
How to detect COM Object Reference Count Errors using Memory Validator
Detecting memory leaks in a .Net Core application
Detecting memory leaks in a .Net Core application child process
Detecting memory leaks in a service
Detecting memory leaks in a service child process
Detecting memory leaks in an IIS ISAPI DLL
Detecting memory leaks in ASP.Net with IIS
Detecting memory leaks in ASP.Net with Web Development Server
Command Line Detecting Memory Leaks in a Child Process
How to Detect Handle Leaks
Memory Validator’s default settings will not detect handle leaks, so the first thing to do is change the settings to enable handle tracking. The following steps will show you how to do this.
- In Novice mode use the quick data settings wizard to select handle information.
- In Intermediate mode use the data collect settings wizard to select handle information.
- In Expert mode use the data collect settings dialog to select handle information.
The following explanation is for intermediate mode and expert mode. In novice mode, the dialog displayed has less choices, the correct choice for collecting handles should be obvious. In novice mode, the data collection settings dialog is the dialog used to configure data collection and data display.
- Display the data collection settings dialog by clicking on the toolbar icon shown below.

The data collection settings dialog is displayed. Select all the check boxes associated with handles. Memory Validator will collect information about these handles when your application is executed.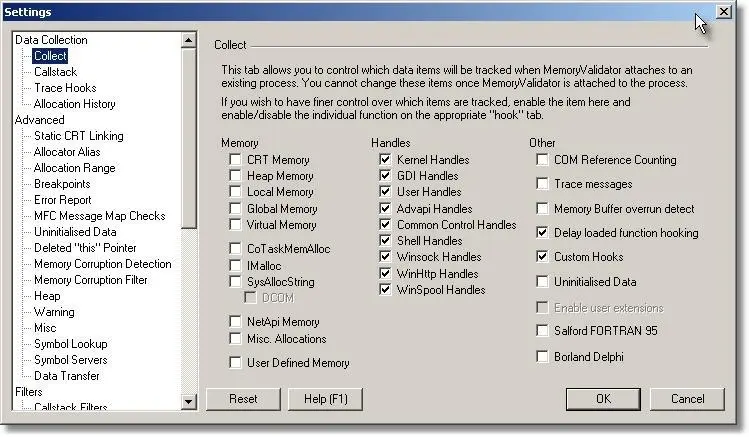
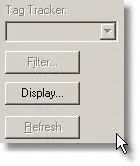
- Display the data display settings dialog by clicking the Display… button on the Memory tab.
The data display settings dialog is displayed. Select the handles check box. Memory Validator will display any data about collected handle information on the Memory tab when your application is executed.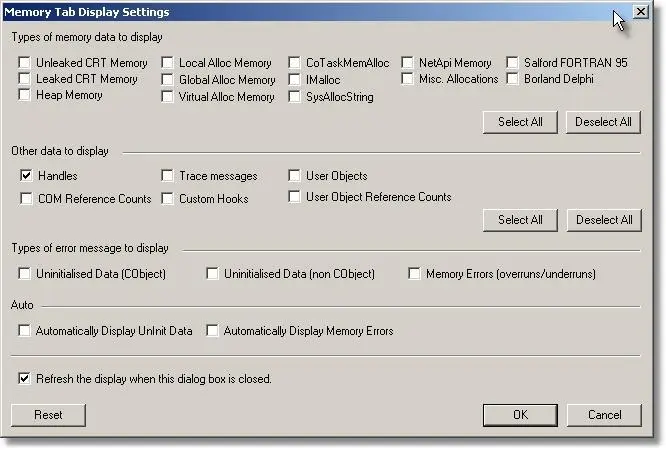
Sample Application
This tutorial will use the nativeExample.exe sample application to demonstrate memory leak detection. The nativeExample.exe application is shipped as a project with source code. The project can be found in the nativeExample directory in the same directory that Memory Validator was installed in. Please compile all configurations of the sample application before continuing the tutorial. The project file is nativeExample.dsp.
Detecting Handle Leaks
To detect handles leaks your application:
-
- Start your program using Memory Validator’s launch program option.
 The launch application wizard displayed.
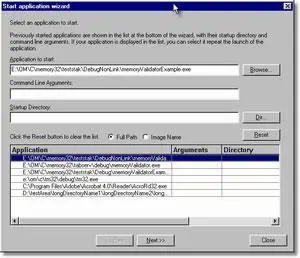
Select [installdir]\nativeExample\debugNonLink\nativeExample.exe using the Browse… button. Accept all default settings and move through all pages of the wizard to the last page. Click the Start Application button.
- Use your program as normal. For the purposes of this tutorial, choose the Create Pen option on the Handles menu. The example program will create a Pen GDI object. Do not choose the Destroy Pen option. This means the application will leak the Pen.
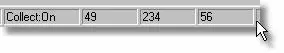
- To improve the execution speed of the application being monitored, Memory Validator puts all collected data onto a queue to send to the Memory Validator user interface. This means the application being monitored does not have to wait for inter-process communications delays. When the Memory Validator user interface receives the data it is also put on a queue to be processed so that the user interface also does not have to wait for inter-process communications delays.As your program executes, Memory Validator monitors the allocations and deallocations you selected using the data collection settings dialog. The data collected is sent to the Memory Validator user interface. Memory Validator displays an indication of how much data is sent the status bar, at the bottom left of the Memory Validator user interface.
- Close your program as normal.
- Memory Validator will analyse all handle allocations and deallocations that occur during the lifetime of the program.
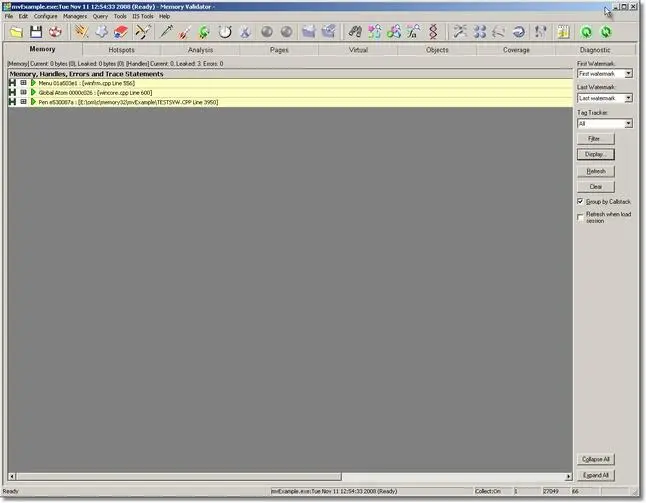
- All outstanding handles are displayed on the Memory Tab. in the colour assigned for memory leaks. The default colour for memory leaks is yellow.
- Start your program using Memory Validator’s launch program option.