The user interface of Page Fault Monitor is shown below.
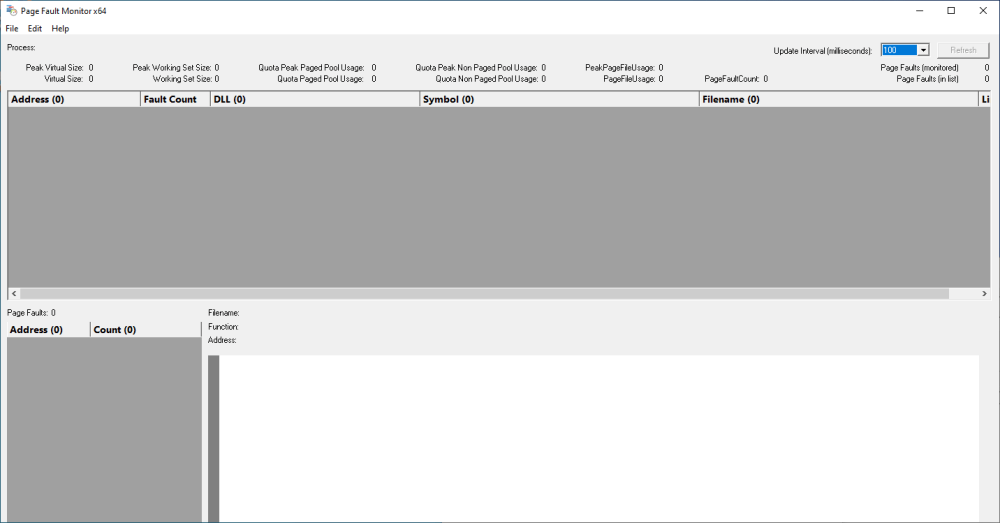
The top list shows all unique addresses that caused page faults for the monitored process.
The bottom list shows the page fault information associated with any address in the top list. Select an address in the top list and the related data is shown below.
For any addresses that we can determine the DLL, symbol, filename and line number, we display that information in the source code window at the bottom of the display.
Above the top list various Virtual Memory status values are shown indicating virtual size, working set size, page file usage and various quota values. The total page fault count for the application is also shown, this value will be different from the number of page faults that Page Fault Monitor has information about. The reason the two values are different is that Page Fault Monitor displays the information Windows NT provides about page faults. Windows NT only stores a limited amount of data about page faults. Once this storage is used up, no more data is stored until after Page Fault Monitor has asked for the stored data. If Page Fault Monitor does not ask for the data frequently enough some information will be discarded by Windows NT.
•Update Interval  changes how often information about page faults is queried. The shorter the interval, the more accurate the information collected about page faults
•No Update choosing No Update in the combo prevents the page fault list from being updated by the timer. When No Update is chosen, the Refresh button is enabled
•Refresh refreshes the processes list and the page fault list
The picture shown below shows Page Fault monitor monitoring coverageValidator_x64.exe.
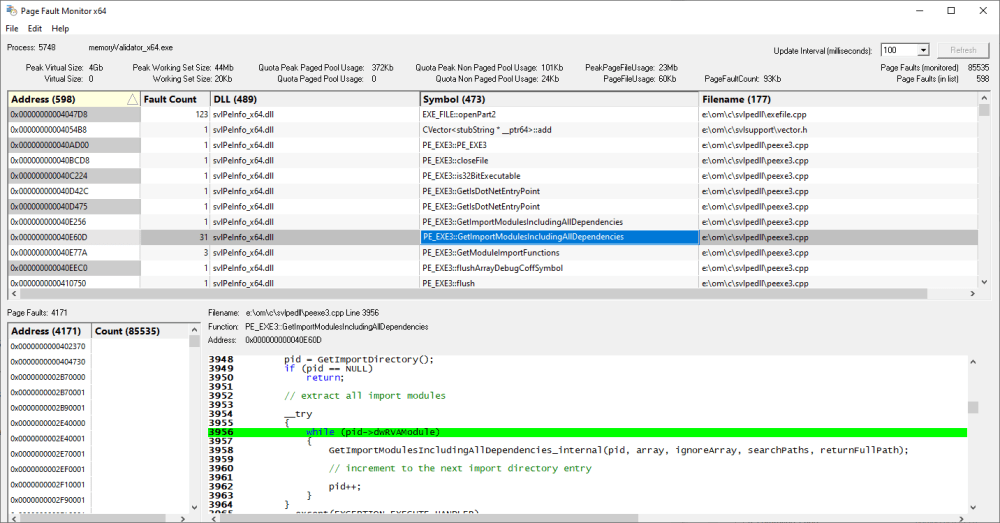
This picture shows process 2808 (coverageValidator_x64.exe) is being monitored for page faults. Page Fault Monitor has collected information about 572 page faults caused by coverageValidator_x64.exe. The top list shows information about the page faults. The list displays the addresses of all instructions that have caused page faults. The Fault Count column indicates how many times this address has caused a page fault. The Fault Addresses column indicates how many different fault addresses are associated with page faults at this instruction address.
When displaying information about instructions, Page Fault Monitor will try to display DLL name, symbol, filename and line number, with the latter being taken from debug information.
Selecting an address in the top list causes information about the page faults at that address to be shown in the bottom list. The source code and symbol information (if known) is also displayed.
Note that the Page Fault count of 564,000 is higher than the numbers monitored by Page Fault Validator because memoryValidator_x64.exe in this example has been running for a very long time, whereas Page Fault Monitor has been running for a few minutes.