The Execution History tab on the tabbed window displays information about the program flow trace. This is known as the execution history view.
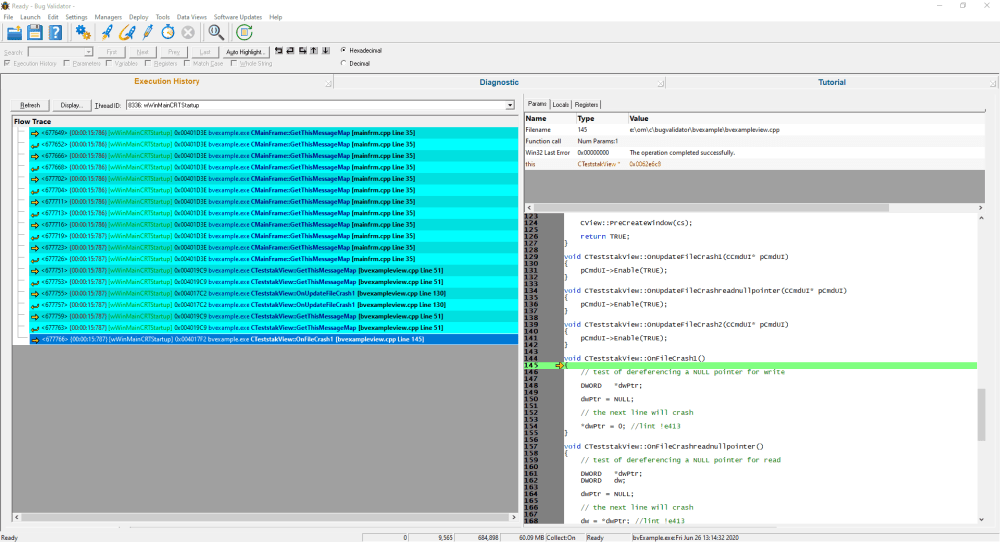
The execution history display is split into two panes. The left hand pane is a tree control showing the execution history lines, the right hand pane displays the parameters, local variables, registers and source code for a particular line. The tree control when expanded shows a small code fragment for the particular line.
Each line displays the thread ID, the DLL name, the program counter, the source file name and the line number for the source file. When multiple threads are displayed, each time the thread ID changes, the background colour for the lines is changed, so that changing execution context is easy to see on the display.
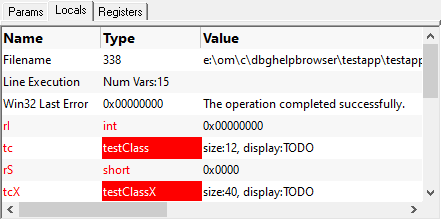
Parameters, local variables and registers are shown in a tabbed window above the source code.
Controls
The file and line controls are shown below.

•Refresh  causes the display to update to show the most recently collected flow trace history for the specified thread(s).
•Display... shows the display settings dialog.
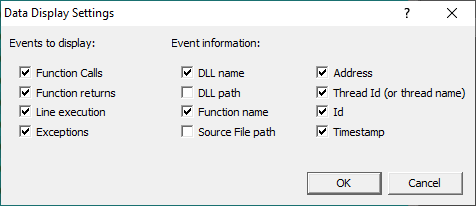
Each check box controls the display of data on the display.
The first column of check boxes control which events will be displayed.
The other two columns control how much data about each event is displayed.
•Thread ID select the thread flow trace you wish to view.
The Thread ID combo box lists the ID of each thread, and it's name (if available).
To show the execution history for all threads, choose All threads.
When displaying the execution history for all threads, the execution history shows the order in which each thread swaps in and out of the thread scheduling, this is highlighted by a change in the background colour for each thread.
Search
The search toolbar can be used to search for data in the execution history. Data can also be automatically highlighted by using the Auto Highlight... button.

To search for data in the execution history the Search field and the First, Next, Prev, Last buttons are used. Previous search texts are remembered in the combo box for easy reuse. The history for search texts is 30 items.
The Match Case and Whole String check boxes affect the pattern matching of the search. Selecting the Match Case check box makes text searches case sensitive. Deselecting the Match Case check box makes text searches case insensitive. Selecting the Whole String check box makes text searches match the entire string. Deselecting the Whole String check box makes text searches match the partial strings.
The Execution History, Parameters, Variables, Registers check boxes control which data areas are searched for a text match.
The Hexadecimal and Decimal radio boxes control the display of Parameters, Variables and Registers in hexadecimal and decimal format, repectively.
The navigation buttons provide the following functionality:
 Go to caller.
 Go to after caller.
 Step into.
 Previous line.
 Next line.
•Auto Highlight Opens the Auto Highlight dialog.
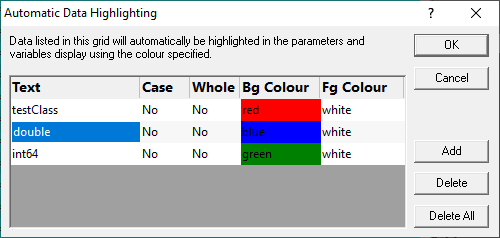
Data matching the search criteria for each item in the auto highlight dialog is highlighted in the data display above the source code window.
The columns in the Automatic Data Highlighting dialog are as follows:
•Text. The text to search for.
•Case. Yes if the search is case sensitive. No if the search is case insensitive.
•Whole. Yes if the text is the entire string. No if the text is a partial match.
•Bg Colour. The background colour for any matching data display.
•Fg Colour. The foreground colour for any matching data display.
The controls are:
▪Add Add an item. Click on each field to edit the contents. The text field is an edit box. The other fields are combo boxes.
▪Delete Delete all selected items on the display.
▪Delete All Delete all items on the display.
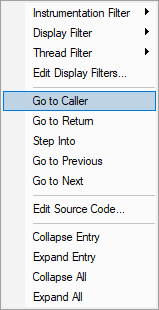
Context Menu
The execution history display provides a context menu.
Instrumentation Filter
The instrumentation filter allows you to prevent various files from being instrumented the next time the application is executed.
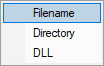
Filename. To exclude the selected item's filename from instrumentation.
Directory. To exclude the selected item's directory from instrumentation.
DLL. To exclude the selected item's DLL from instrumentation.
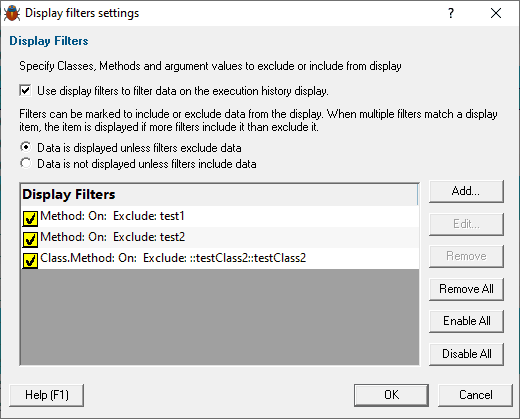
Display Filter
The display filter allows you to control the information displayed on the execution display.
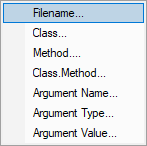
Filename... To filter using the selected item's filename.
Class... To filter using the selected item's class name.
Method... To filter using the selected item's method name.
Class.Method... To filter using the selected item's class name and method name.
Argument Name... To filter using the selected item's argument name.
Argument Type... To filter using the selected item's argument type.
Argument Value... To filter using the selected item's argument value.
Thread Filter
The thread filter allows you to control which threads are displayed on the execution display
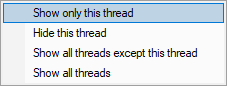
Show only this thread. Shows only this thread and hides all other threads.
Hide this thread. Hides the selected thread. All other threads remain shown or hidden with no change to their display state.
Show all threads except this thread. Displays all threads except the selected thread.
Show all threads. Displays all threads.
Edit Display Filters...
Opens the display filters dialog.
Go to Caller
Move the current item to the caller of this item.
Go to Return
Move the current item to the return from this item.
Step Into
Move the current item to the first child item of this item.
Go to Previous
Move the current item to the previous item.
Go to Next
Move the current item to the next item.
Edit Source Code...
Edit the source code of this item.
Refresh
Refresh this display with the current data.
Refresh All
Refresh all displays.
Collapse Entry
Collapse this entry.
Expand Entry
Expand this entry.
Collapse All
Collapse all entries.
Expand All
Expand all entries.