C# and C++ code coverage - Coverage Validator 9.77
Struggling to get code coverage for your software written in multiple languages?
Do you want to visualize your code coverage as your application executes? – to allow you to identify parts of your code to test while you are testing.
Do you want to automate your code coverage collection, merging multiple test runs into one code coverage result?
Do you want to post your code coverage results on your company intranet, in HTML, or export in XML or Cobertura formats for other tools to consume?
If that sounds like you, we’ve got a code coverage tool for you.
3 Minute Video
Coverage Validator is a code coverage software tool for use by software developers and software quality assurance testers using .Net, .Net Core (C#, VB.Net, etc) and native language compilers (C, C++, Delphi, VB6, Fortran etc.).
Use Coverage Validator to:
- Determine code coverage for your software projects.
- Identify untested functions in your unit tests.
- Improve your software quality testing with interactive, real-time code coverage displays.
- Merge code coverage data to provide aggregate code coverage results for all your unit tests.
- Support automated code coverage testing using the command line API (Jenkins, etc.).
- Create automated code coverage reports for your unit test, smoke tests, regression tests and overnight builds.
- Generate code coverage reports at the same time as creating unit test reports.
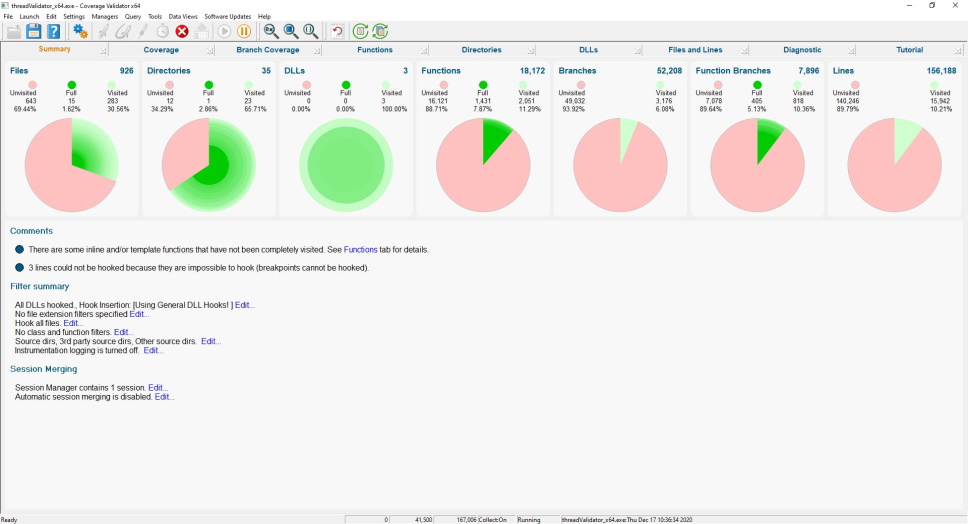
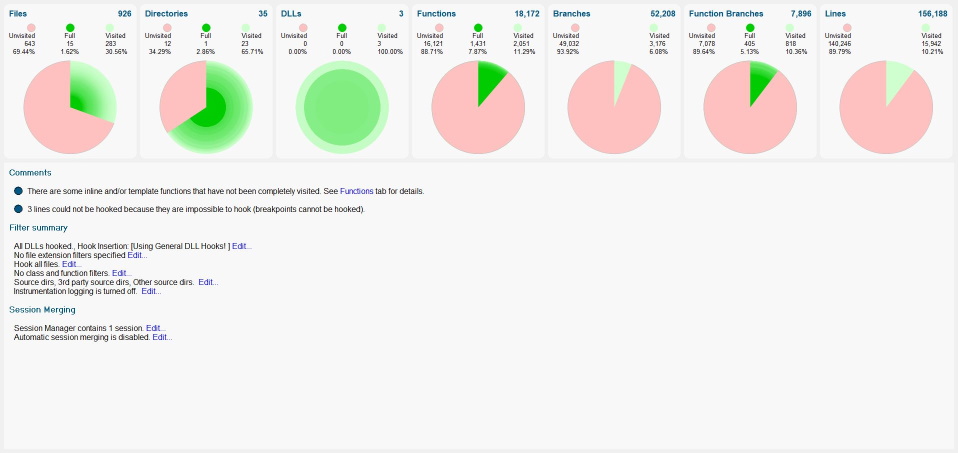
Summary
The summary view displays overall statistics for the code coverage of the instrumented application.
Statistics are shown for file coverage, directory coverage, DLL coverage, function coverage, branch coverage, lines coverage.
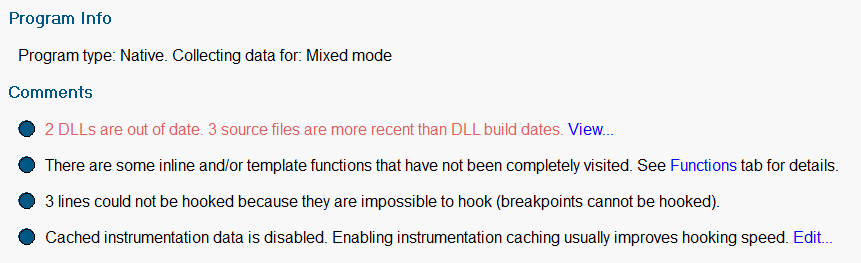
The panel below shows important information relating to instrumentation settings, instrumentation warnings and errors you need to know about and easy access to settings that affect these warnings.
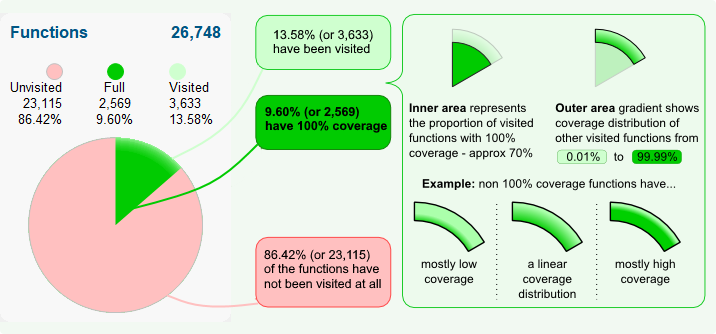
This dial summarises data on a total of 26,748 known functions in a complex target program
The radius of the inner area may grow or shrink as the target program runs, since the proportion of visited functions that have 100% coverage can go up or down.
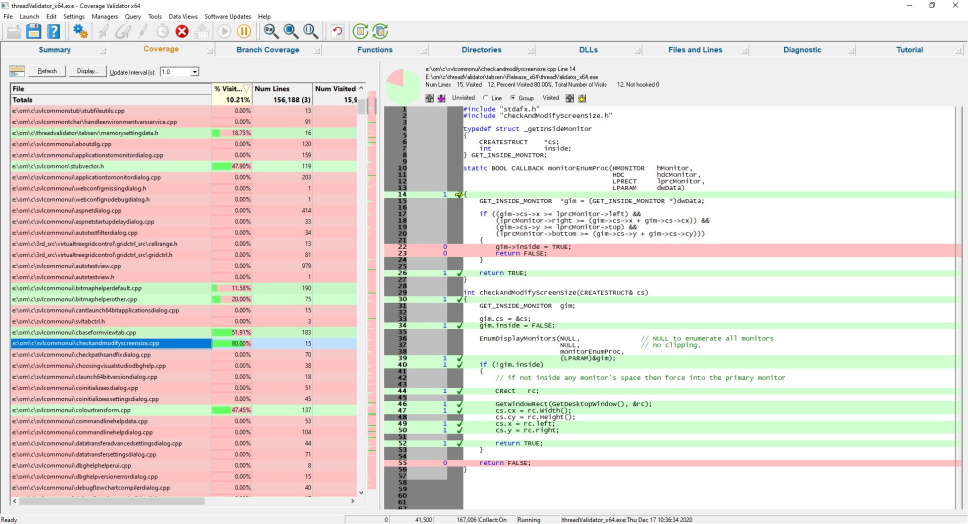
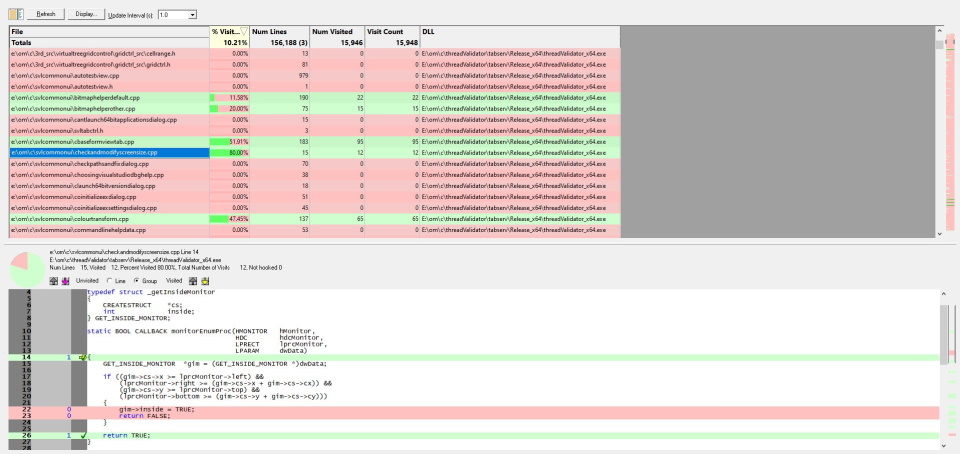
Detailed Coverage Statistics
The coverage view displays statistics for each file that is being monitored for code coverage.
The statistics are updated in real-time – allowing you to perform interactive testing of code paths using your application’s GUI and watching the code coverage change in real-time.
You do not need to wait for your application to finish before finding out how much of the source code has been executed.
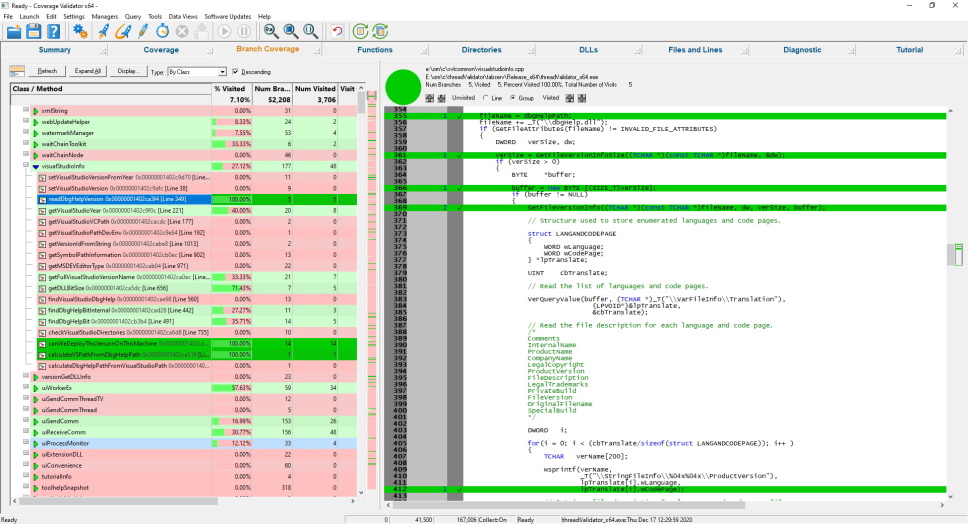
Branch Coverage
The Branch Coverage view displays statistics for each function that contains branching code that is being monitored for code coverage.
The data is displayed in a tree format, with the top level showing class and the second level showing the functions and methods in each class.
The data can be displayed by Class, Function, File, Directory location, and the number of lines in a function.
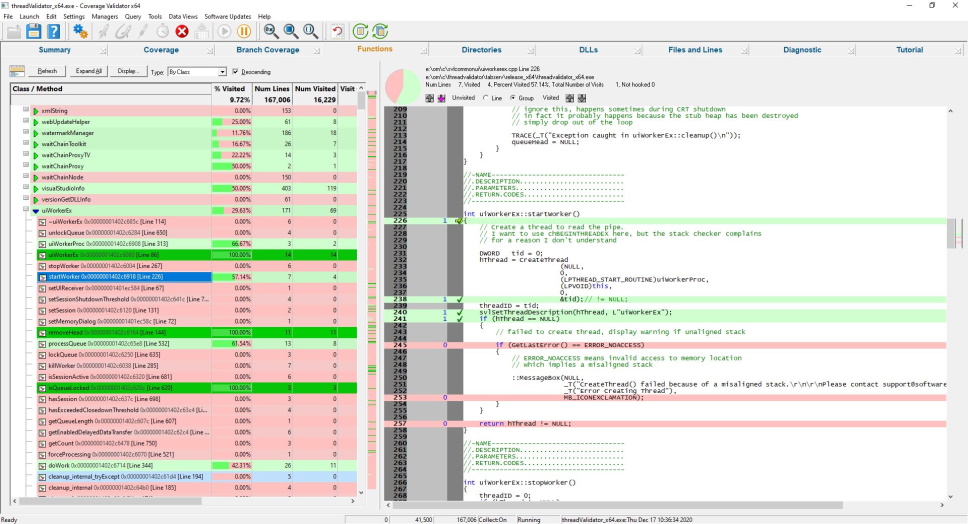
Functions
The Functions view displays statistics for each function that is being monitored for code coverage.
The data is displayed in a tree format, with the top level showing class and the second level showing the functions and methods in each class.
The data can be displayed by Class, Function, File, and by the number of lines in a function.
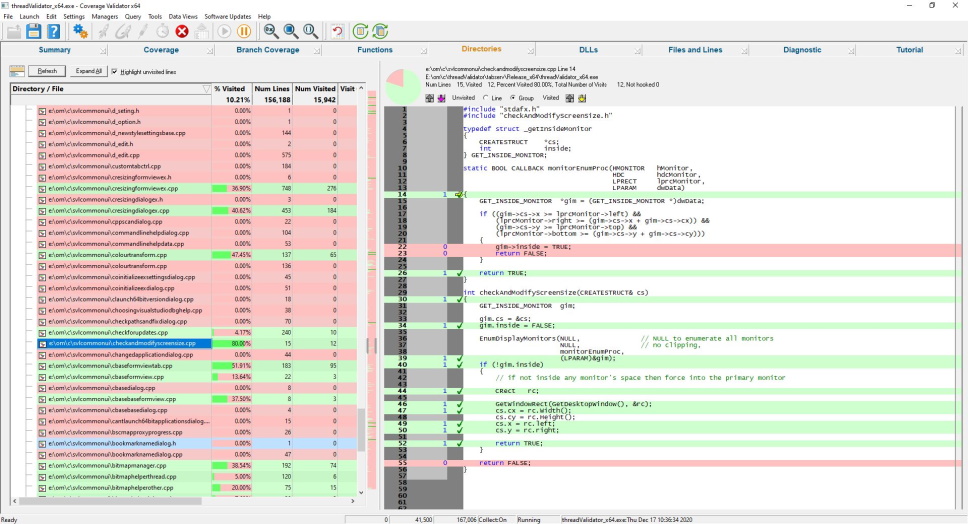
Directories
The Directories view displays statistics for each directory that is being monitored for code coverage.
The data is displayed in a tree format, with the top level showing the directory and the second level showing the source files in each directory.
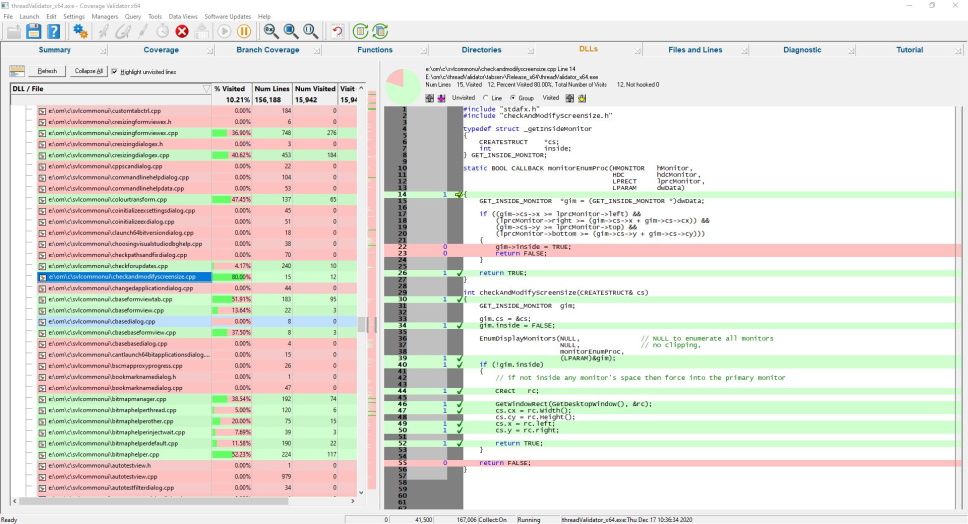
DLLs
The DLLs view displays statistics for each DLL that is being monitored for code coverage.
The data is displayed in a tree format, with the top level showing the DLL and the second level showing the source files in each DLL.
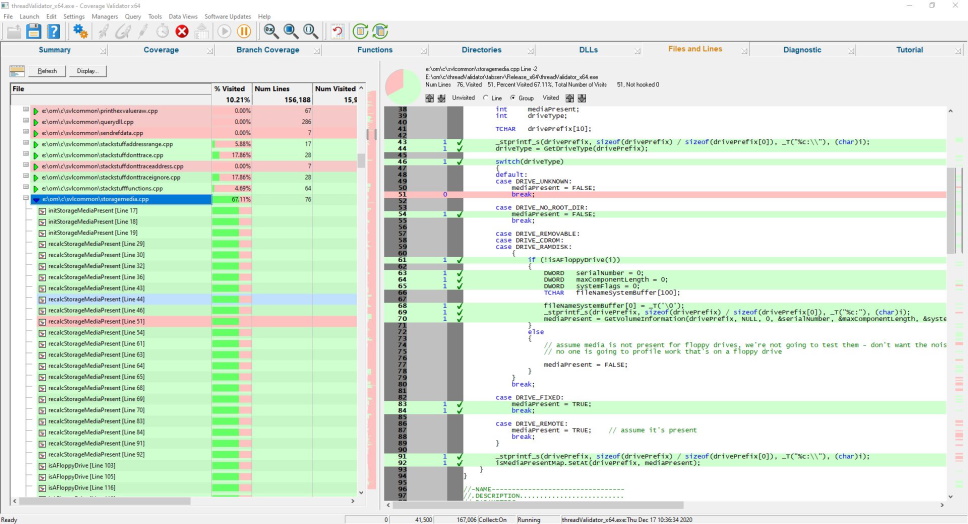
Files and Lines
The Files and Lines view displays statistics for each file and line that is being monitored for code coverage.
The data is displayed in a tree format, with the top level showing files and the second level showing the lines in each file.
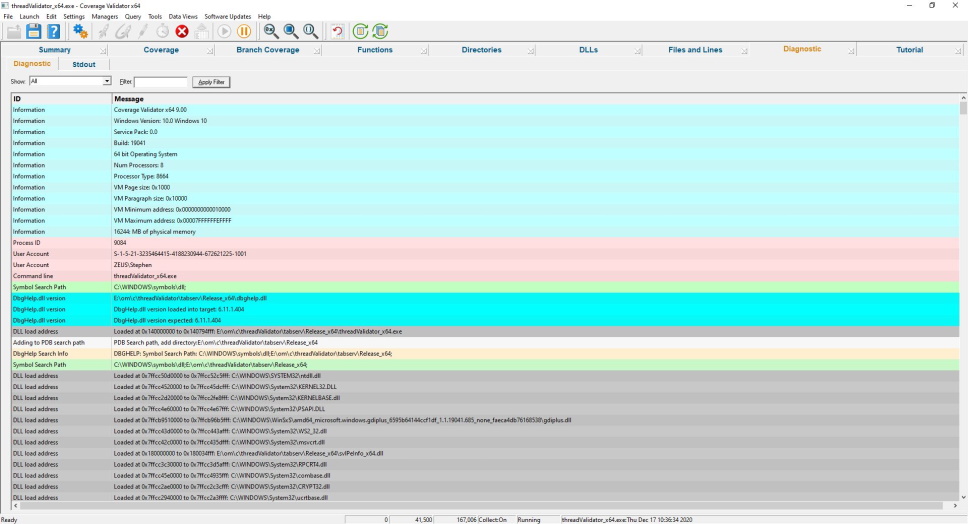
Diagnostics
The diagnostic display informs you of any information that you need to know which may affect the performance of Coverage Validator.
- DLL load address
- Symbol information search/load/success/failure
- Instrumentation success and failure
- Disassembly of troublesome code
- Misc diagnostic info
- Env vars
- Stdout/Stderr
Get to work in minutes
You don’t need to modify your application, recompile your software or relink your application.
Just launch your application from Coverage Validator and start collecting code coverage data immediately.
Coverage Validator uses your software’s debug information to perform the instrumentation of your software. Supported debug formats are PDB, TDS, DWARF, STABS and COFF. We can also use MAP files if line number information is present.
Working with a service or IIS/ISAPI?
You don’t need to modify your software unless you are writing a service or working with IIS.
If you’re working with a service or IIS there is a simple API you can use that you can “fit and forget”. It’s so easy to use you can leave the API linked into your release product – it will do nothing unless Coverage Validator is present.
5 step code coverage
This simple 5-step process is how you collect code coverage data.
- Launch your application with Coverage Validator.
- Run your application as normal.
- Optional: Examine the code coverage statistics that Coverage Validator generates as your application runs. The code coverage updates in real time. Using your knowledge of the software to exercise different parts of the application to increase code coverage. Verify the parts you expected to be covered were covered.
- Close your application.
- Examine the code coverage statistics after your application has finished.
Intuitive data displays show you the code coverage as your application executes. You do not need to wait until your application has finished viewing statistics for any function, file or DLL. The displays can be filtered to show you only the information that you want to work with.
Detailed, colour-coded source code shows at-a-glance which functions and lines have been visited and how many times each line has been visited. These displays update in real-time as your application runs.
Configurable
Coverage Validator can be configured to collect all data or just the data you need. Powerful filters for collecting data and for displaying collected data give you maximum flexibility and control over how much CPU time is spent and how much memory is used collecting data allowing you to choose how much effort is put into a given task.
API
Coverage Validator provides an API for using Coverage Validator with services for the case when Coverage Validator cannot inject into a service because of Windows NT security privileges preventing the injection (typically for services running at Administrator or system level).
This API is also used when working with IIS (Internet Information Server).
Filtering
The default options of Coverage Validator provide code coverage for all DLLs and files in your application that have debugging information. If you wish to only create coverage reports for selected DLLs or exclude certain file types or even specific classes and methods, Coverage Validator has filtering capabilities to allow such customisation.
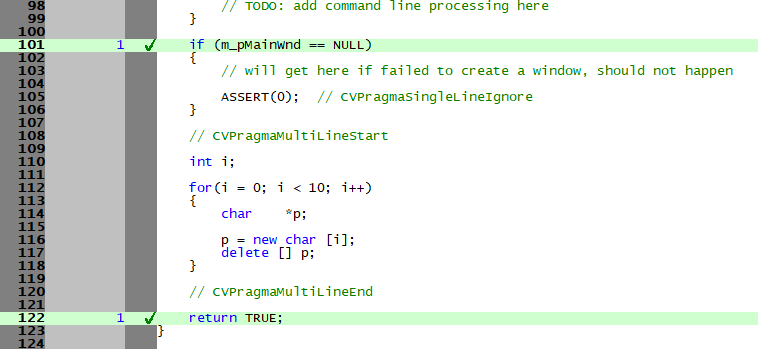
Code exclusion
Sometimes however, there are sections of code that you would like to exclude code coverage statistics for but traditional filters cannot do the job. This is often case when you want to exclude some error handling code from your coverage testing. Coverage Validator allows you to include markers in your source code comments to indicate which parts of your code to exclude.
In the picture below you can see that an ASSERT(0); has been excluded (line 105) as has a for-next loop (lines 112-118).
Code coverage data merging
If you’re like many companies, you’ve probably got a short test suite, an overnight test suite and a multi-day test suite. Each suite consists of many tests, and you’re wondering how to get code coverage for all of them.
Coverage Validator provides four code coverage merge options:
- Automatic code coverage merging to a central code coverage session. Code coverage results are automatically merged in real-time to a central session as each code coverage test is run or for code coverage results to be merged into a session of your choice after the fact. The merged code coverage results can be reset manually or automatically when the target executable gets updated (changes timestamp or changes name). All of this can be controlled via the user interface and via the command line, providing you with complete control over the process.
- Manual code coverage session merging of 2 sessions via the user interface. Immediately see the merged code coverage results.
- Command line code coverage session merging of 2 sessions.
- Command line code coverage session merging of multiple sessions. This is ideal for merging the results of many code coverage sessions.
Code coverage comparison
If you’re collecting code coverage for your test suite, you’ll want to compare code coverage to see if the test coverage increased or decreased with the new tests.
This is supported both graphically with a user interface and also from the command line.
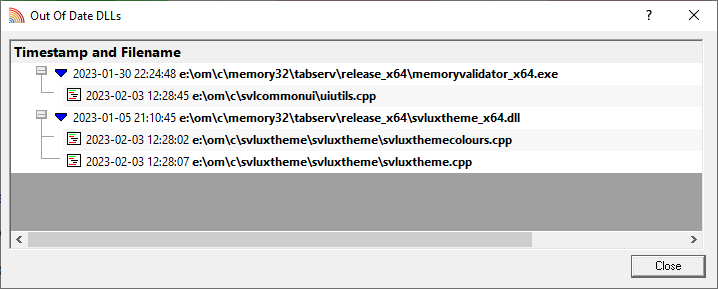
Out of date build detection
When you have problems with your build process or code check-in this can result in binaries that do not match the source code. This leads to broken and confusing code coverage reports. Your code coverage tool needs to be able to detect this and warn you when things go wrong.
Exporting code coverage data
Coverage Validator provides powerful HTML and XML reporting capabilities, allowing you to produce overnight code coverage reports as part of your regression testing strategy.
Cobertura XML export is also supported, allowing you to continue working with tools that import Cobertura data formats.
Compatible
Coverage Validator works with compilers from:
| Vendor | Language | Compiler / IDE |
|---|---|---|
| Microsoft | C++, C, Visual Basic 6, C#, VB.Net, J#, F#, .Net, .Net Core | Visual Studio, Visual Studio Community Edition, Visual Studio Express |
| Intel | C++, C, Fortran | Intel Performance Compiler, Intel Fortran |
| Embarcadero | C++, C, Delphi | C++ Builder, Delphi, Rad Studio |
| MinGW | C++, C | g++ / gcc |
| Cygwin | C++, C | g++ / gcc |
| MSYS2 | C++, C | g++ / gcc |
| LLVM | C++, C | Clang |
| Qt | C++, C | QtCreator |
| Metrowerks | C++, C | Code Warrior |
| Salford Software | Fortran 95 | Fortran 95 |
We support many versions of Visual Studio: Visual Studio 2026, 2022, 2019, 2017, 2015, 2013, 2012, 2010, 2008, 2005, 2003, 2002 and Visual Studio 6 are supported. We also support Visual Studio Community Edition and Visual Studio Express.
All 64 bit (x64) and 32 bit (x86) Windows operating systems, from Windows 11 to Windows XP, are supported.
.Net and .Net Core
If you’re using .Net and/or .Net Core, Coverage Validator supports these technologies. All .Net versions are supported. All .Net Core versions are supported.
If you’re also using native code with your .Net applications, we’ve also got that covered. Mixed-mode applications are supported.
Applications, services, web servers
Coverage Validator works with applications, services and IIS/Web Development Server, both native and mixed-mode .Net.
Support for all forms of testing
As well as the traditional code coverage role that Coverage Validator performs, it can be used for interactive code coverage testing and for creating code coverage reports automatically as part of a unit test, smoke test, pre-check-in test, regression test suite, rolling build test and/or overnight build.
Command Line
Automate code coverage collection by launching Coverage Validator from the command line.
A full range of command line options allows you to perform unattended code coverage with Coverage Validator, complete with HTML export, XML export and Cobertura XML export, to facilitate regression testing as part of your overnight builds.
If you find the idea of writing command lines hard, we’ve made writing them easy, with our command line builder.
Example 1 Launch an application, when the application completes save the results and refresh some displays.
coverageValidator.exe -program "c:\myProgram.exe"
                      -saveSession "c:\myResults\session1.cvm"
                      -displayUI -refreshResults -refreshCoverage
Example 2 Launch an application, when the application completes merge the coverage results with the loaded session and save the merged results.
coverageValidator.exe -program "c:\myProgram.exe" -directory "c:\testarea" -hideUI
                      -loadSession "c:\myResults\session1.cvm"
                      -mergeSessions
                      -saveMergeResult "c:\myResults\session2.cvm"
Example 3 Merge results from previous sessions.
coverageValidator.exe -hideUI
                      -loadSession "c:\myResults\session1.cvm"
                      -loadSession2 "c:\myResults\session2.cvm"
                      -mergeSessions
                      -saveMergeResult "c:\myResults\session1+2.cvm"
Software Updates
We update our software tools on a regular basis – on average about 26 updates per year. Updates are optional, you only need to download the most recent update to be up-to-date.
You can set up automatic software updates using the credentials we supply to you when you purchase. Automatic software updates can be setup to check daily, weekly, monthly or never.